Barcelona · available immediately

Juan PabloOsorio Rivera

Data scientist and AI engineer by training, generalist by trade: pipelines, computer-vision models, retrieval systems, and the dashboard that puts the result in front of someone.

233kpostings deduplicated
11ATS systems unified
0.90mIoU, snow segmentation
15labelled queries benchmarked

What I do

01

I work across the chain: pipelines and warehouses, computer-vision and time-series models, retrieval systems, and the dashboards that put the result in front of someone.

Chemical engineer first, so I ask what the number means before I ask whether the model is clever. Most of my work ends with a table: configurations, a labelled evaluation set, and a hit rate that someone else can reproduce.

Projects

02

2025–26PyTorch · segmentation · Earth observation

snowy

Snow-cover estimation from 12 camera stations in the Pyrenees: 0.90 mIoU and +0.10 AUROC over the baseline. First-author paper under review at Computers & Geosciences; best presentation award, Ljubljana.
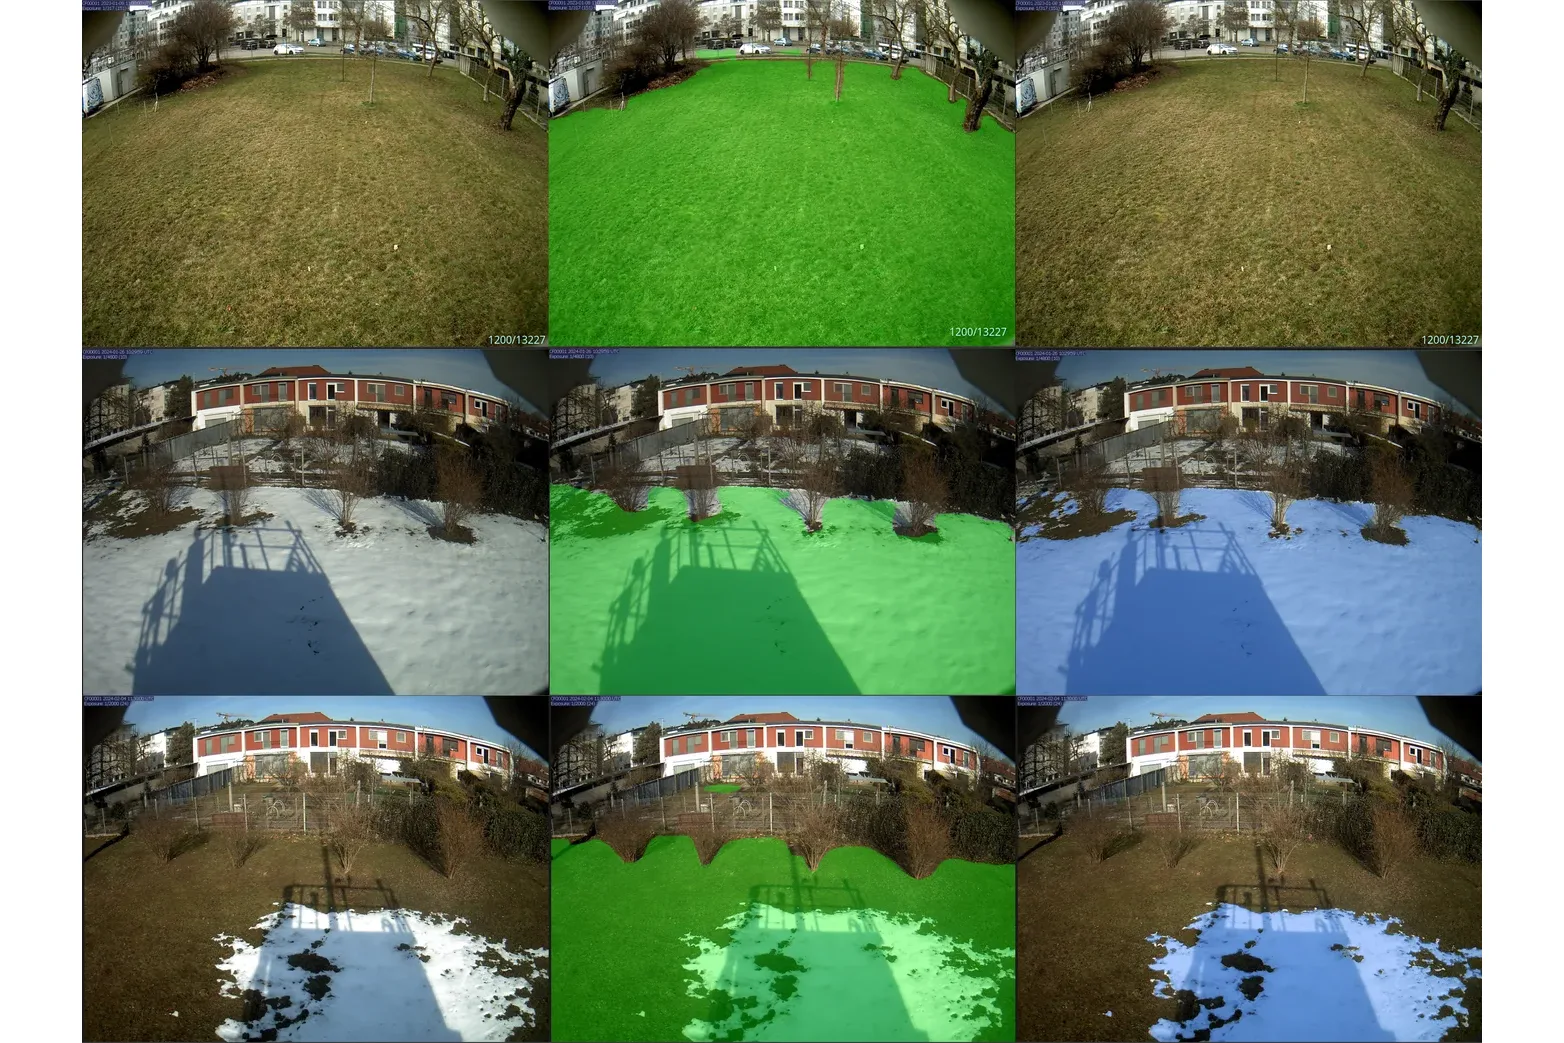
Three webcam frames from one training station, each shown with the ground mask in green and the snow mask in blue
One of the nine stations the model trained on: the frame, the ground mask (green) and the snow mask (blue) as labelled.
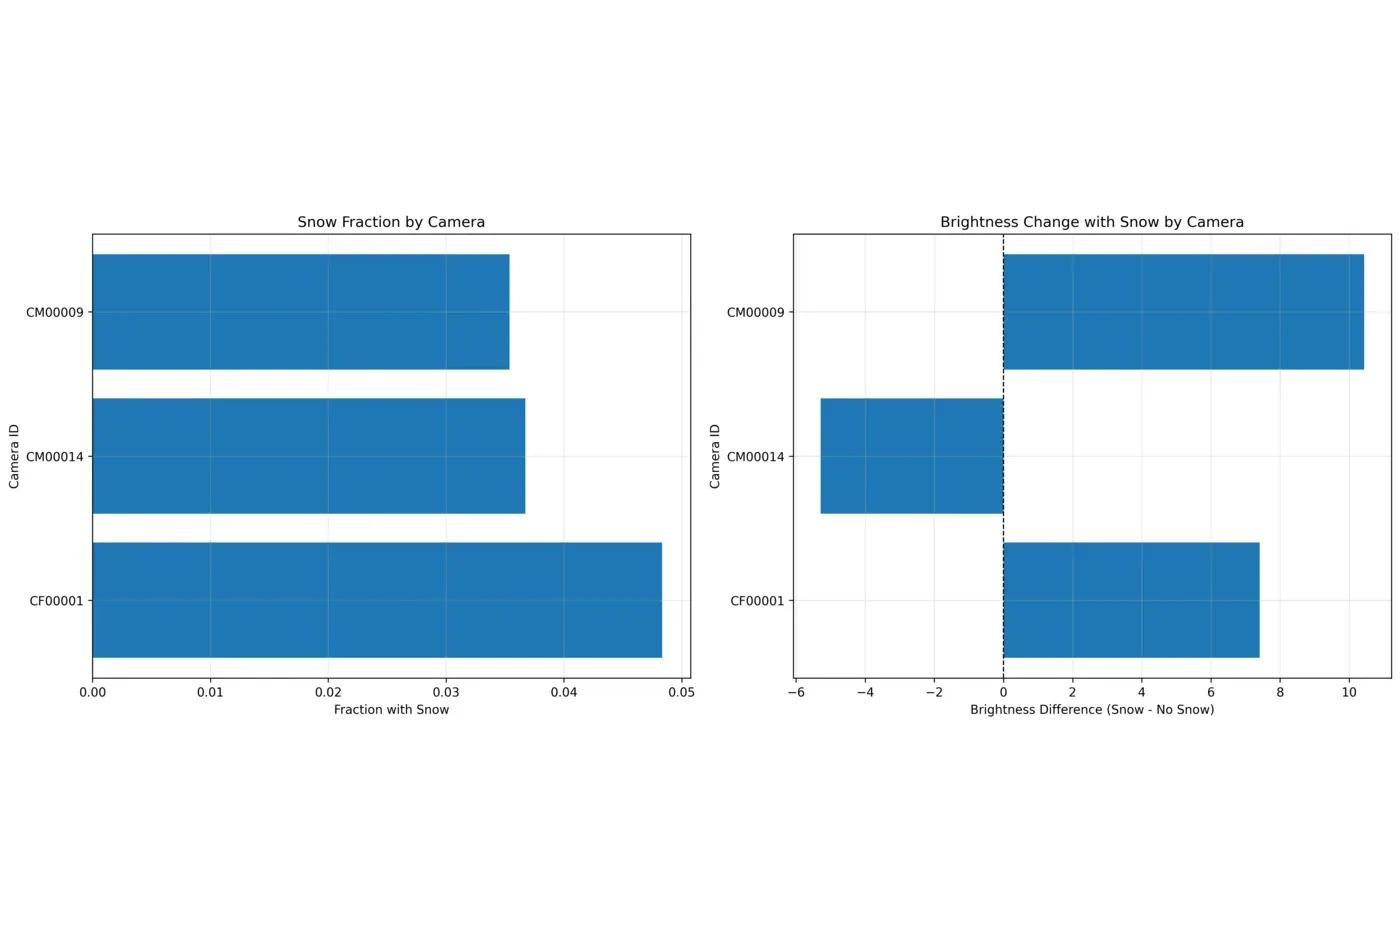
Two bar charts: snow fraction for three stations, and the brightness difference between snow and no-snow frames for the same three
Snow fraction per station, and the brightness change snow causes, for three of the stations: one darkens under snow, two brighten.
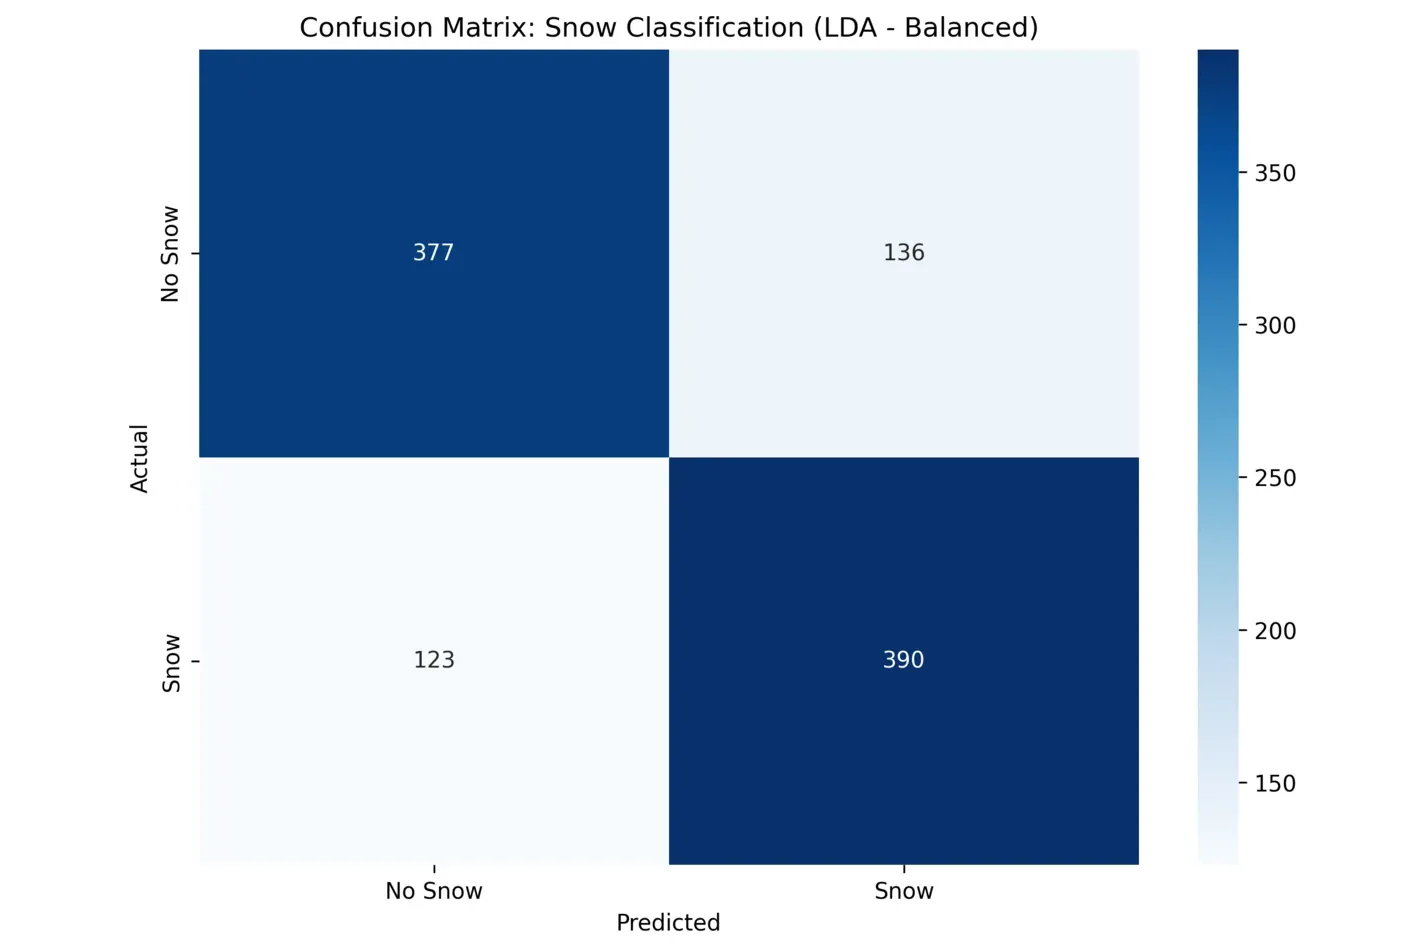
Confusion matrix for snow versus no-snow classification with LDA on a balanced split
Snow vs no-snow from handcrafted image statistics alone: LDA on a balanced split, 767 of 1026 frames correct.

2026Python · DuckDB · dbt · SQL · pytest · GitHub Actions

hiresignal

A job-market warehouse: 233k postings from 11 applicant-tracking systems, deduplicated on keys that are not unique, modelled into a star schema with dbt, with SQL marts and a dashboard generated from the data itself. Tests fail the build when a rule breaks.
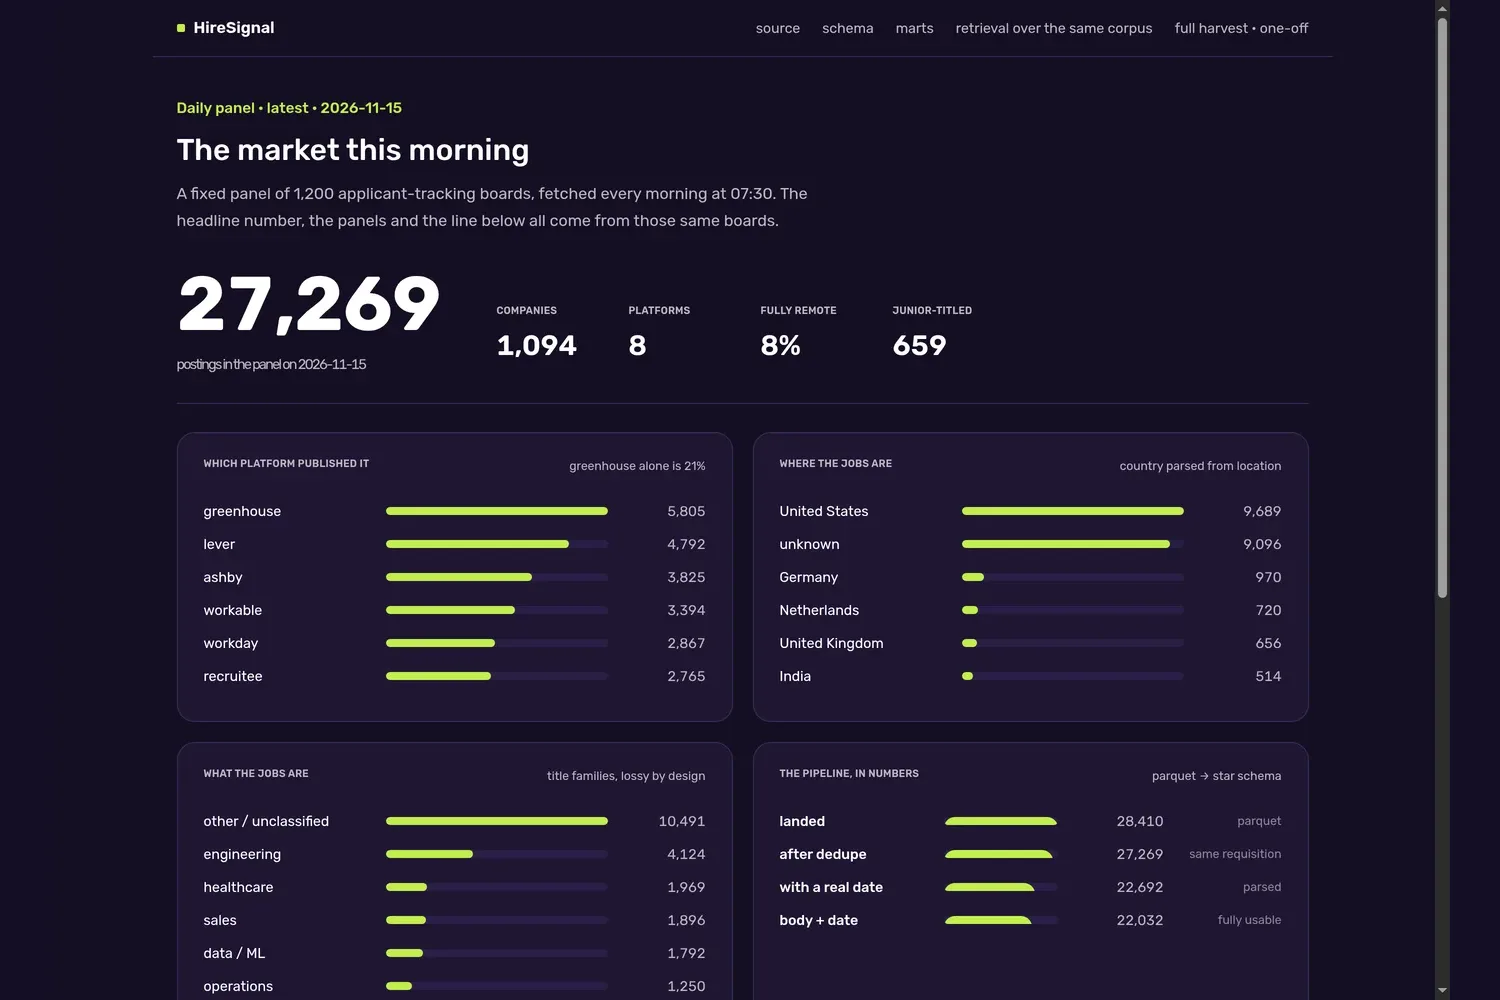
The HireSignal dashboard: a headline count above panels for platform, country, job family and pipeline stages
The live dashboard — a fixed panel of 1,200 boards, fetched every morning. Screenshot, 15 November 2026.

2026BM25 · embeddings · reciprocal rank fusion · FastAPI

rag-service

Retrieval over the same corpus, answering with citations. Every configuration is benchmarked on 15 labelled questions, and the README reports the ones that lost.

hit@1 over 15 labelled queries
Retrieverhit@1MRR
BM250.8500.850
Hybrid (RRF)0.8020.763
Dense only0.6000.567
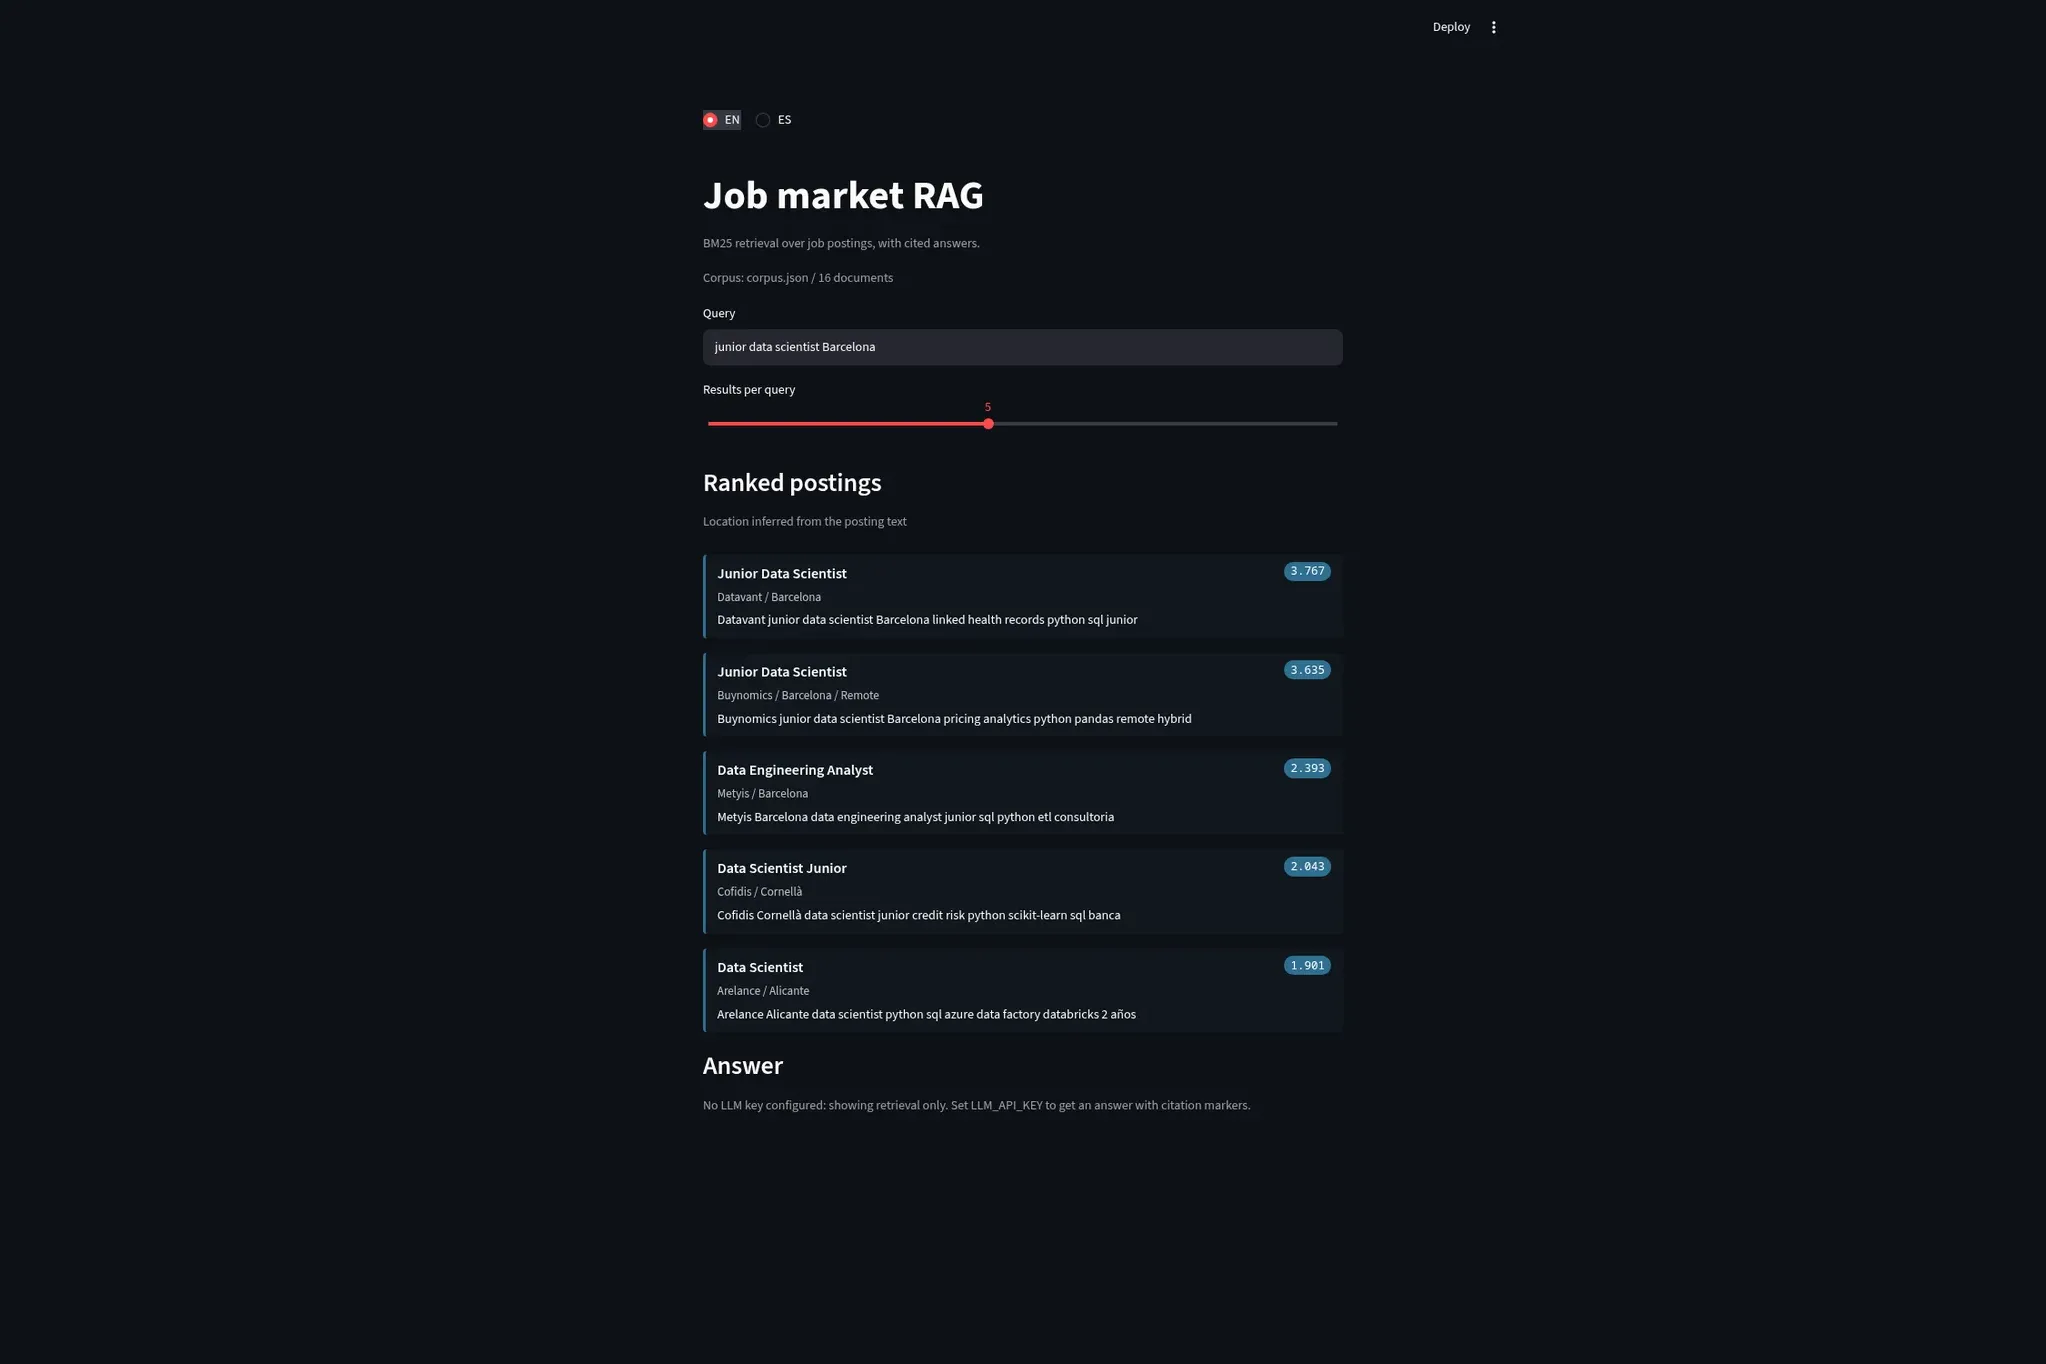
The retrieval interface: a question box above a list of ranked postings and a cited answer
A question in, ranked postings and a cited answer out.
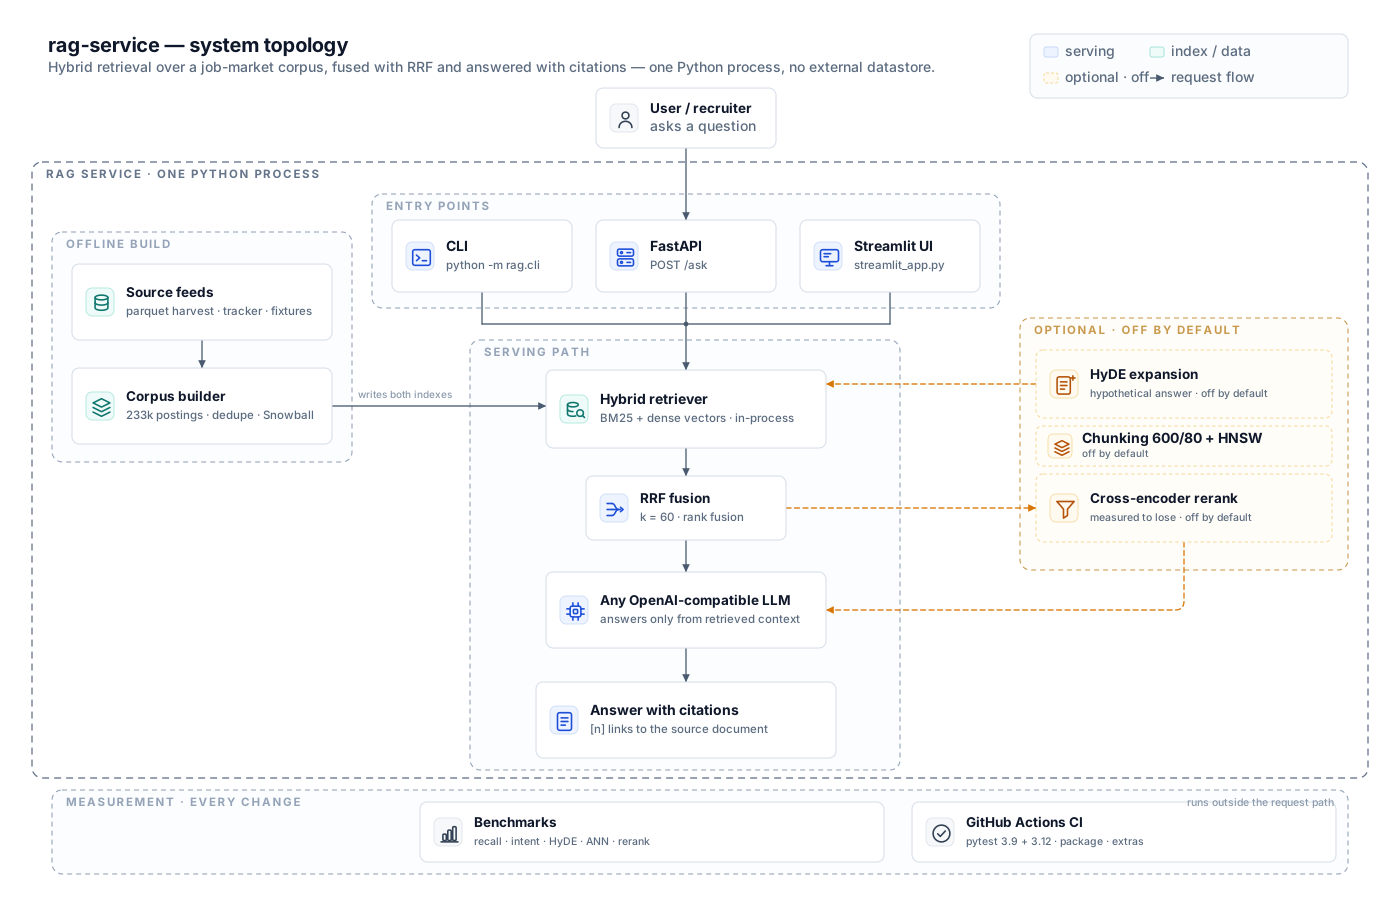
Architecture diagram: entry points, serving path, offline build and measurement tiers
The pipeline in tiers: entry points, serving path, offline build, and the measurement layer beside them.

2025PyTorch · LoRA · ONNX · MVTec AD2

Repro-INPFormer

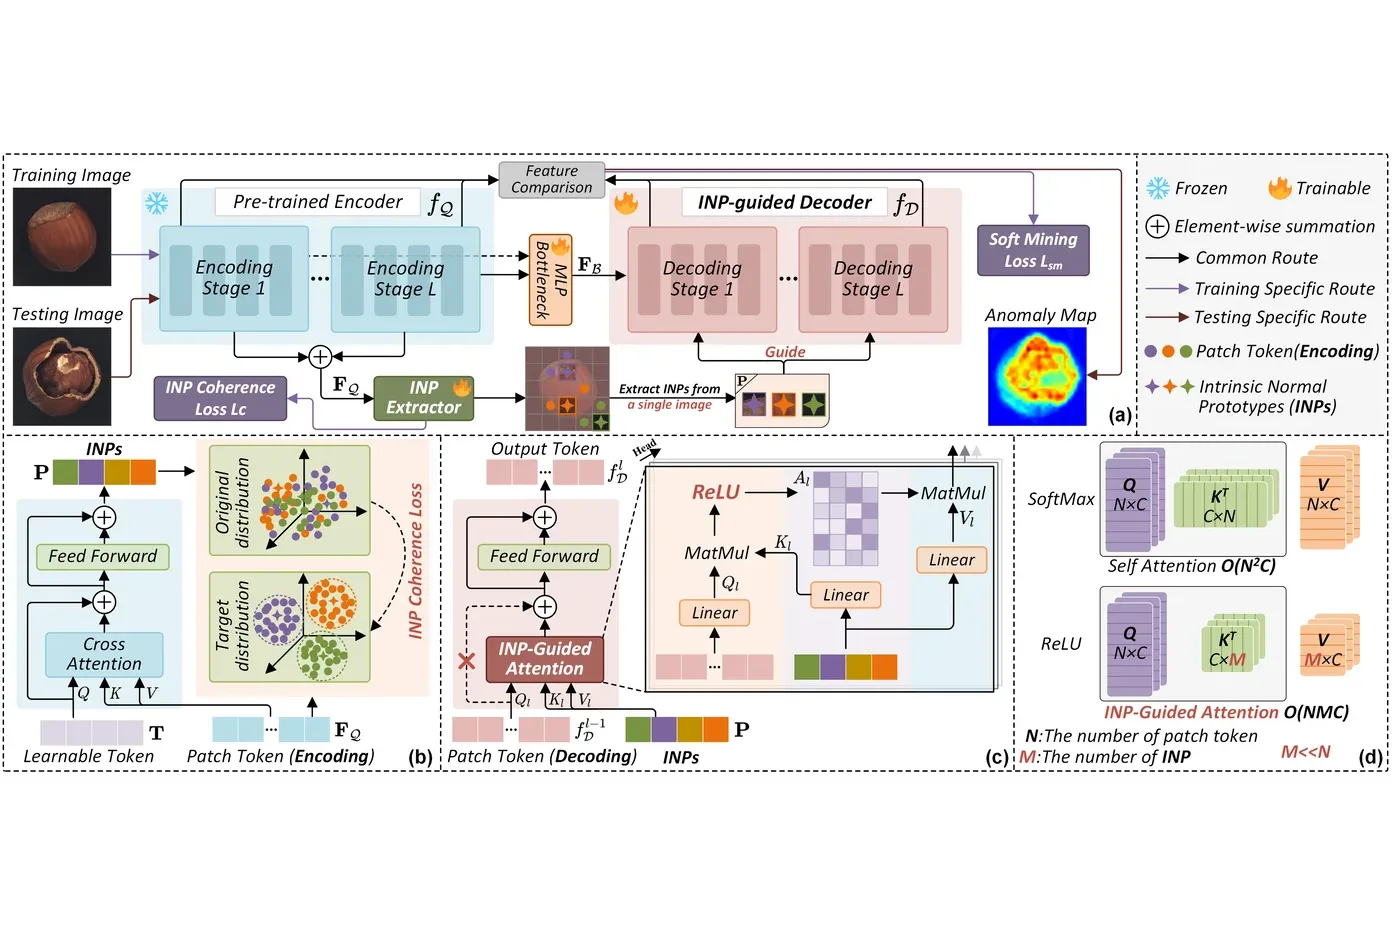
Reproduction and extension of a CVPR 2025 anomaly-detection method: the experiments of the original paper re-run, then LoRA fine-tuning, ONNX export and FLOPs profiling on top.
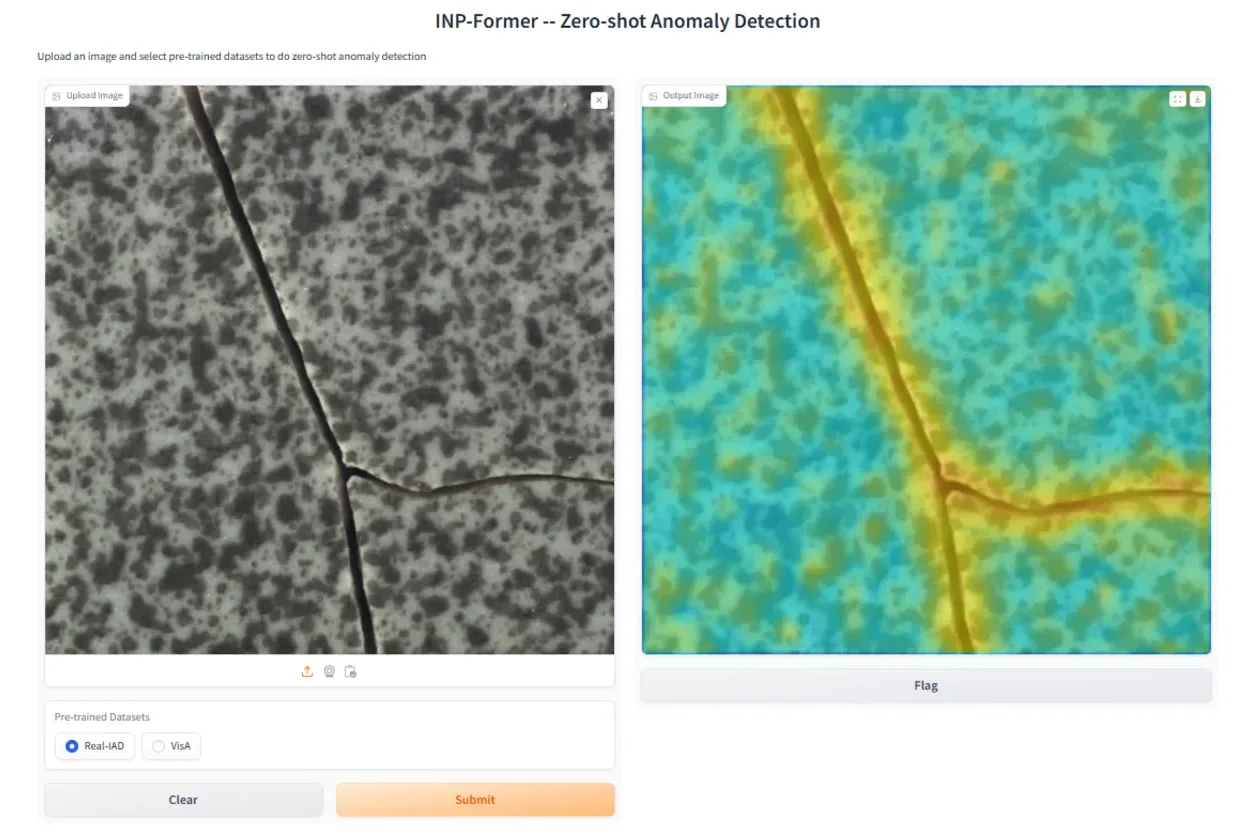
Demo interface showing an original image beside an anomaly heatmap, with a threshold slider
The demo built on the reproduced model: image in, anomaly heatmap out, threshold on a slider.
Pipeline diagram of the INP-Former method with its module blocks and losses
The method being reproduced — INP-Former's pipeline (figure from Luo et al., CVPR 2025).

2025Python · HMM · clustering · mobility data

modes-of-transportation-ds

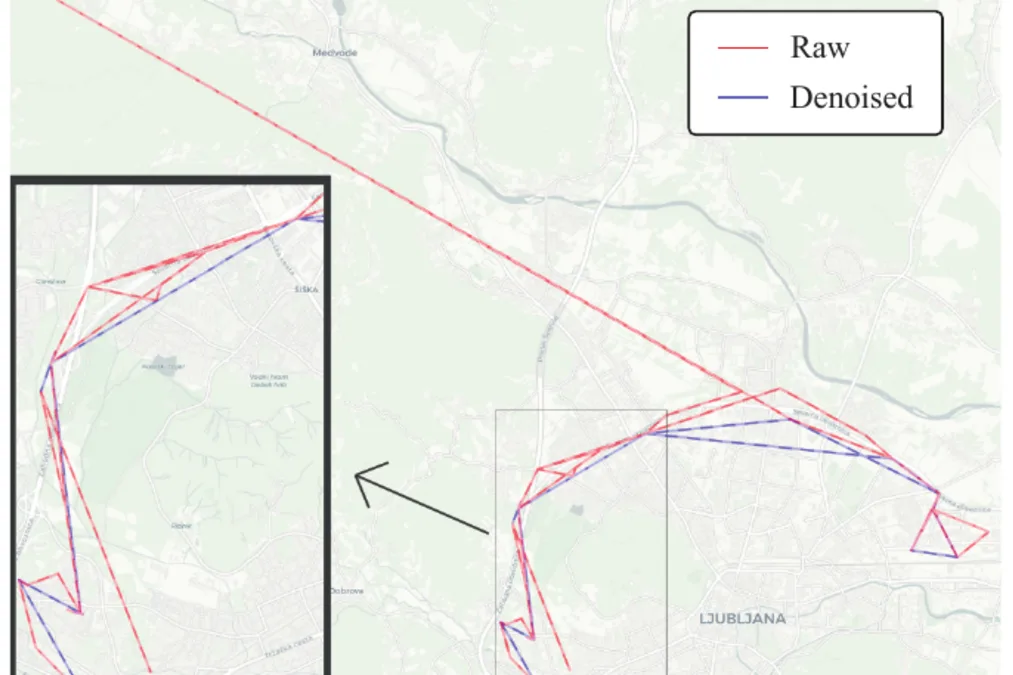
Transport-mode inference from cellular network data, for the FRI Data Science competition (Slovenia): features per subscriber-hour, then an HMM over the sequence rather than a label per point.
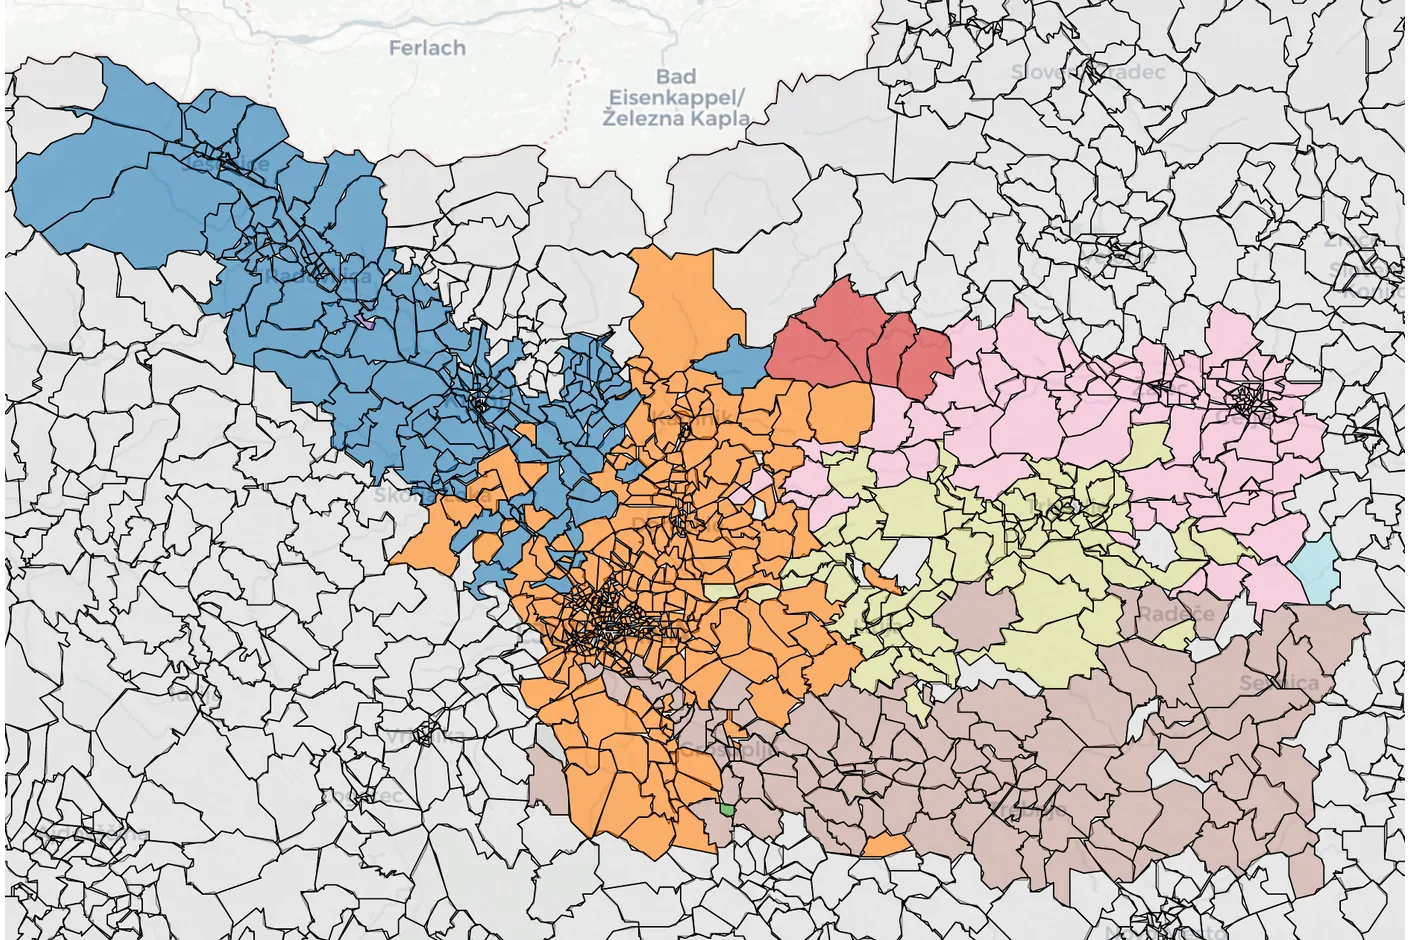
Map of Slovenia divided into zones coloured by cluster, showing six groups covering the country
Spectral clustering of origin–destination flows over the zone grid: the groups are commuting basins, and they do not follow administrative borders.
Map near Ljubljana with a raw GPS trace in red and the denoised trace in blue, plus a zoom box
The denoising step, before and after: raw tower fixes jump between cells, the filtered path is a route a person could have taken.
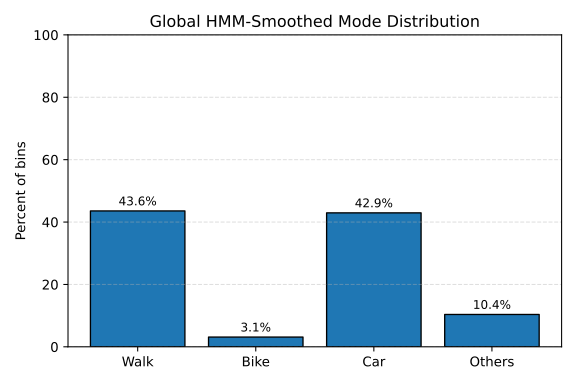
Bar chart of transport mode distribution: walk 43.6 percent, bike 3.1, car 42.9, others 10.4
Mode mix recovered from the network data, smoothed with an HMM.

2024Python · pandas · public health data

SIVIGILAMeta

A paper registry of chemical retailers, normalised and joined to notified poisoning cases, turned into a map by municipality that a small team used to decide where to inspect.
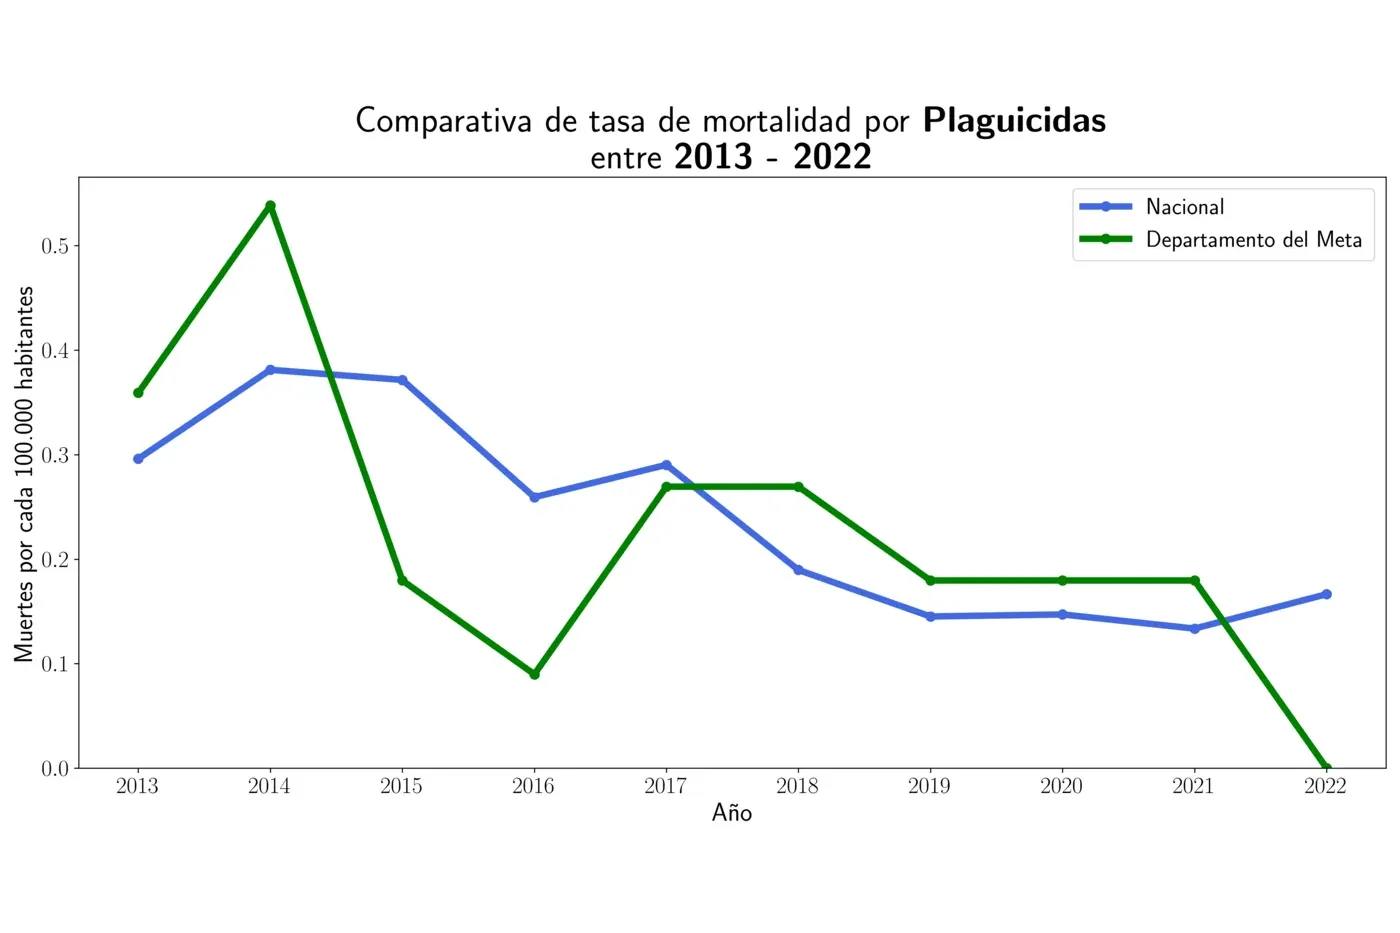
Line chart of pesticide-related mortality rate for the same period and the same two series
Mortality, same registry and same comparison.

2024Python · Parquet · distributed processing

big-data

End-to-end analysis of New York City TLC trip records: preparation, scalable processing, and the results written up — the project where I learned to stop loading everything into memory.
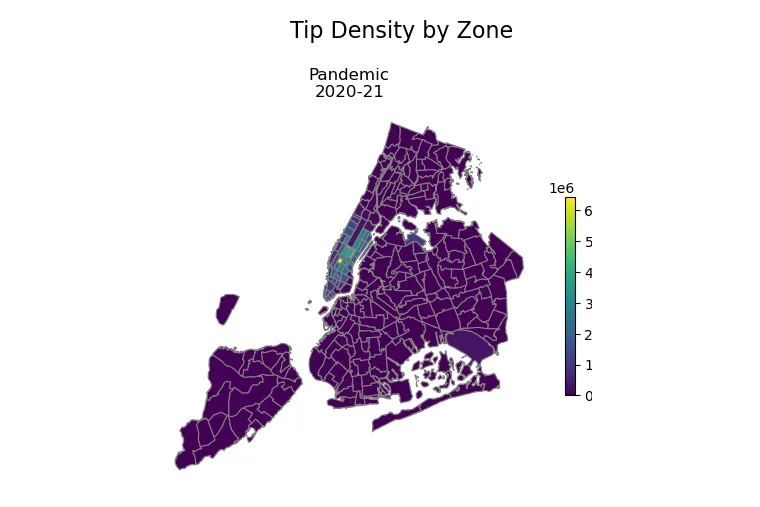
Map of New York City taxi zones coloured by tip per square kilometre, with a hotspot over midtown Manhattan
Tip per km² by taxi zone, pandemic period — one of three periods in the same figure. Midtown carries the colour scale; almost everywhere else is flat.
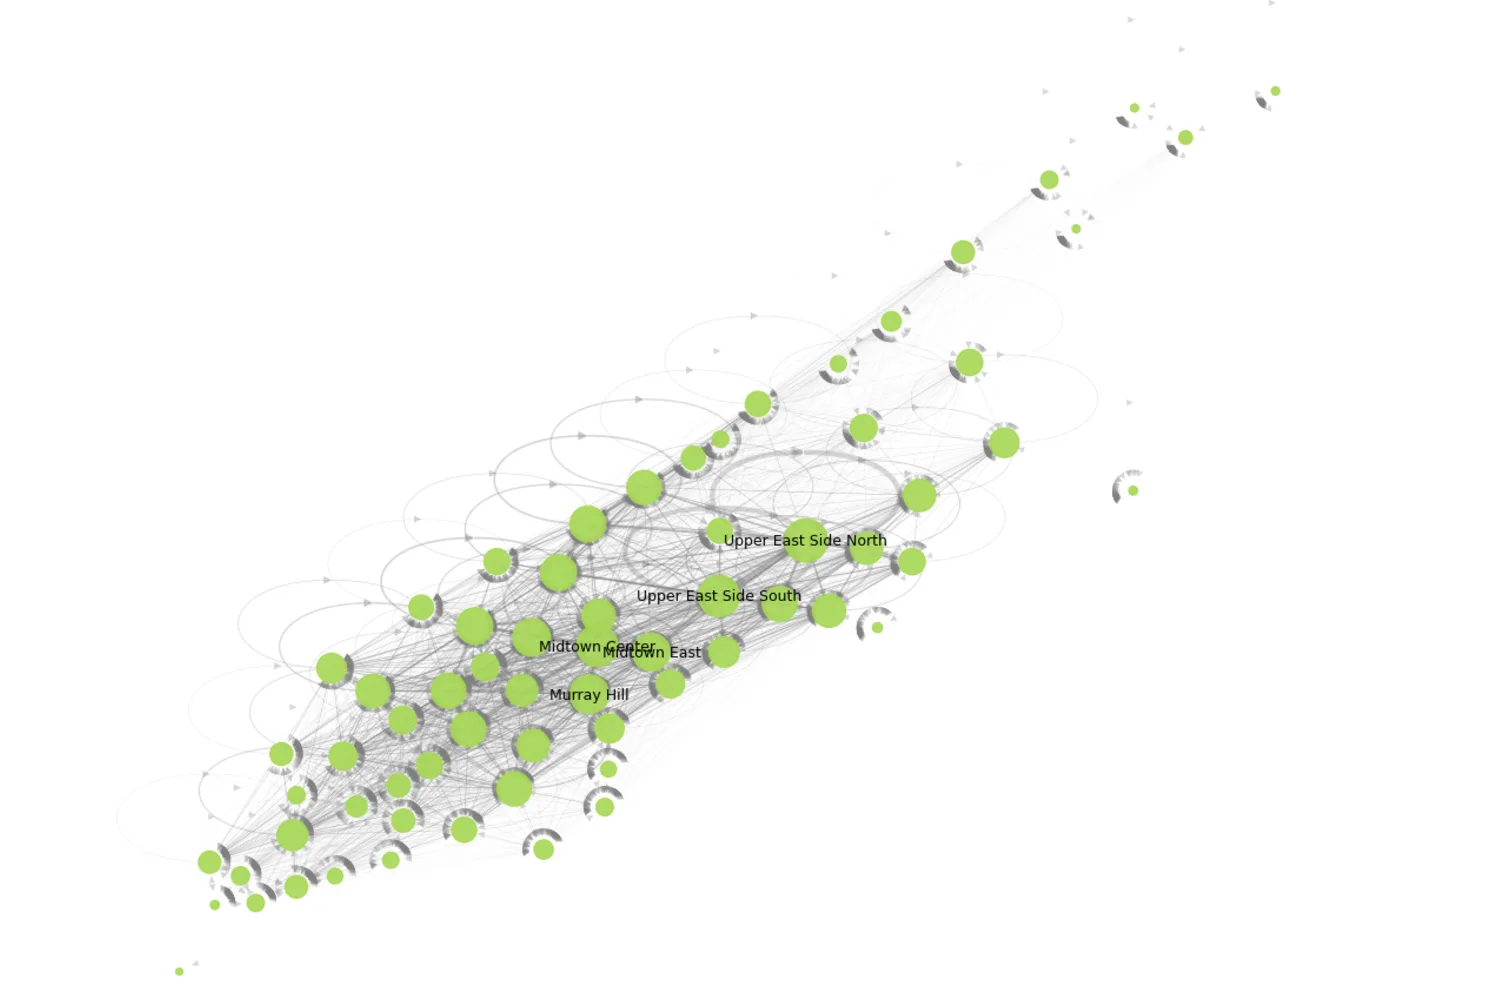
Network graph of taxi zones: green nodes linked by grey edges, sized by outgoing PageRank
Zones as nodes and trips between them as edges, sized by outgoing PageRank. The shape is Manhattan, recovered from the flows alone.

Path

03
  1. 2024

    Data Analyst — Secretaría de Salud, Gobernación del Meta

    Bogotá, Colombia

    Digitised and normalised the registry of chemical retailers, joined it to health surveillance records, and produced the municipality-level picture that replaced equal-share inspection planning.

  2. 2024–25

    Technical Consultant — Consultors Ambientals de Negocis

    Project-based

    Feasibility studies for waste-to-energy and biogas projects: mass and energy balances, equipment sizing, process economics, and vendor documentation checked against specification.

  3. 2024–26

    MSc Artificial Intelligence

    Universitat Pompeu Fabra, Barcelona · University of Ljubljana · 8.54/10

    Thesis graded 10/10: snow-cover segmentation from camera imagery for a national meteorological service.

  4. 2023

    BSc Chemical Engineering

    Universidad de los Andes, Bogotá · 3.86/5.0

Toolkit

04

Languages

  • Python
  • SQL
  • R
  • MATLAB
  • Bash

Data

  • pandas
  • GeoPandas
  • DuckDB
  • Parquet
  • PostgreSQL / pgvector

Machine learning

  • PyTorch
  • scikit-learn
  • embeddings
  • evaluation harnesses

Engineering

  • Git
  • Docker
  • GitHub Actions
  • pytest
  • FastAPI
  • Power BI / DAX

Contact

05

Hiring, or building something in data? Send it over.

If you are hiring or collaborating, send a message — it reaches my inbox directly.

Or write to me directly at jp.osorio4102@gmail.com. This form is delivered by Web3Forms; nothing is stored on this site.